

Four nations will make their World Cup debut this year: Uzbekistan, Jordan, Cape Verde, and Curaçao under the new 48-team format. The remaining 44 participants all have prior experience in football’s biggest global stage, and their past performances are the focus of today’s analysis.
The Novibet Blog uses the language of numbers to confirm or debunk common myths and perceptions: Is Brazil really such a high-scoring team? Do the Scots truly play aggressively? Are the English naïve in defense? Which teams have the greatest tendency to score from penalties?
Everything you need to know to be fully prepared for betting action at the 2026 World Cup!
Best Attacks in World Cup History
Public perception gets it right here. Brazil truly embodies the philosophy of “score and entertain.” With 237 goals in 114 matches, the Seleção averages just over 2 goals per game (2.08), ranking first in this category. Germany follows closely behind with 2.07 goals per match, while Turkey sits third (albeit with fewer games played) at 2 goals per match.
Other major footballing nations follow with small differences: France (1.86), the Netherlands (1.75), Portugal and Argentina (1.74), and Spain (1.61 goals per match).
Worst Attacks in World Cup History
This category is dominated by nations with little to no World Cup history: Canada (0.17 goals per match), Qatar and Iraq (0.33). Close behind are teams of similar stature such as Panama, Haiti, and New Zealand (0.67 goals per match each).
A special mention goes to Zaire, included as the predecessor of today’s DR Congo, which will compete in this year’s tournament. Zaire remains the only nation never to score a goal in a World Cup finals, and, as we’ll see, that’s not its only negative record.
Best Defense in World Cup History
England is the surprise leader here, proving less naïve than many believe. They concede an average of just 0.92 goals per match. Second place goes to another unexpected contender, the Netherlands (0.95), with Brazil completing the top three at the same average.
Germany’s famously solid defense concedes 1.16 goals per match, while Uruguay’s “tough” defense allows 1.29, placing them well outside the top spots.
Worst Defense in World Cup History
Zaire once again takes center stage, largely due to a historic defeat: a 9–0 loss to Yugoslavia, featuring a hat-trick from Dušan Bajević. It remains one of the biggest scorelines in World Cup history.
That match was overshadowed by a financial scandal, as Zaire’s players had threatened not to play after dictator Mobutu failed to deliver promised bonuses. FIFA ultimately covered the payments, but the team took the field under protest—and were heavily punished by their opponents.
Zaire’s average of 4.67 goals conceded per match is matched by Haiti, while Panama (3.67) and Saudi Arabia (2.53) follow.
Penalty Goals in World Cup History
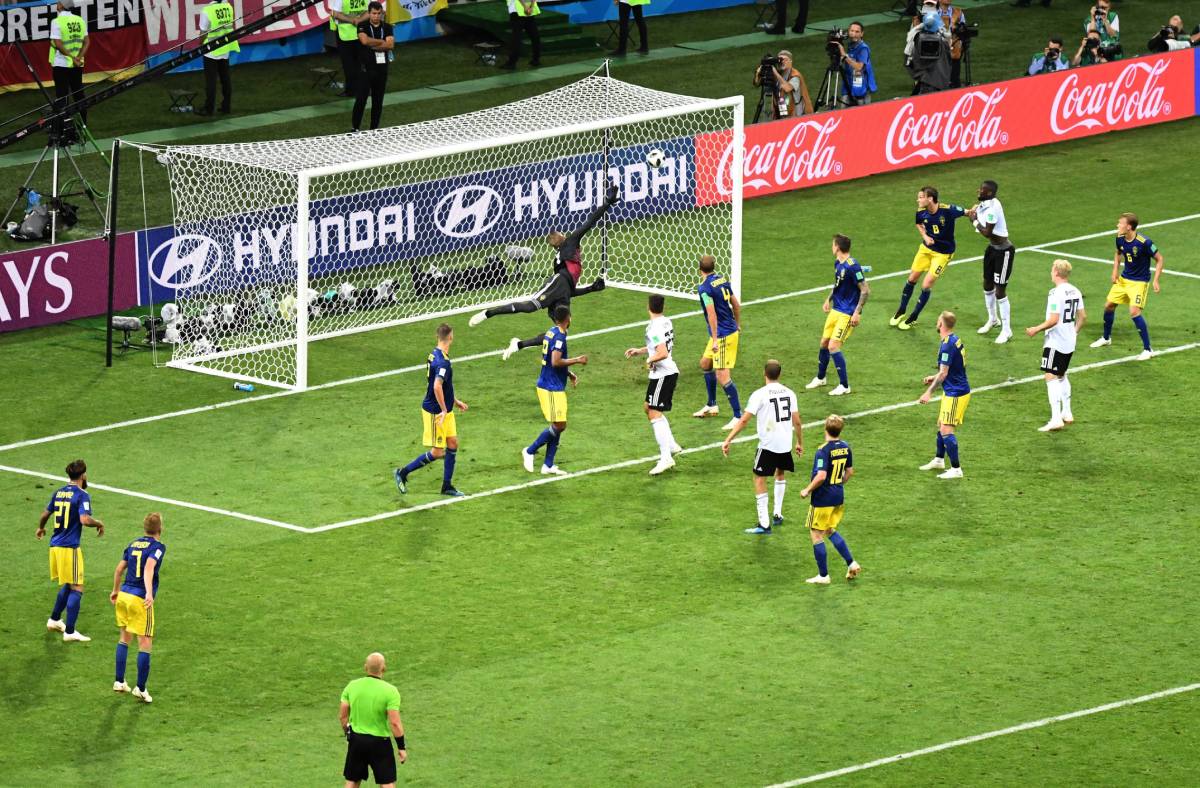
Egypt surprisingly leads this category. The “Pharaohs” have scored 2 penalties out of just 5 total goals in World Cup matches, giving them the highest average at 0.29 per game.
Cristiano Ronaldo has significantly boosted Portugal’s numbers, placing them second with 0.26 penalty goals per match. Spain ranks third (0.24), while 12 nations have yet to score a single penalty goal in World Cup history.
Yellow Cards in World Cup History
Contrary to popular belief, Scotland does not play aggressively. In fact, they would top the Fair Play rankings, averaging fewer than one yellow card per match (0.78). Only three other nations come close: Austria (0.83), England (0.85), and the Czech Republic (0.91).
At the other end, Panama (3.67) and Iraq (3.33) have the highest averages, though based on limited matches. Ghana’s figure (2.87) is more representative, followed by South Africa (2.56) and Ivory Coast, Qatar, and Senegal (2.33 each).
Red Cards in World Cup History
Zaire also leads this category, with one red card in just three matches, giving them the highest average (0.33 per game). South Africa follows (0.22), with Canada third (0.17).
Among teams with the fewest red cards, excluding 14 nations that have never had a player sent off, Spain stands out: just one red card in 67 World Cup matches.
Under / Over 2.5 Goals in World Cup History
To conclude, let’s look at one of the most popular betting markets: Over/Under 2.5 Goals.
Excluding Panama and Haiti, who have a 100% over rate but from only three matches, Ivory Coast leads with an impressive 77.78% of matches exceeding 2.5 goals. Turkey follows with 70%, along with several mid-tier nations (Qatar, New Zealand, Austria, Scotland, Bosnia & Herzegovina, Zaire) all above 60%.
Among traditional football powers, over 2.5 goals is still more common, though with more balanced percentages: Germany (57.14%), Brazil (54.39%), Portugal (54.29%), Uruguay (54.24%), France (53.42%), Argentina (51.14%).
On the other hand, England stands out with 62.16% of matches finishing under 2.5 goals, while Iran tops this category with 72.22%.
Stay up to date with our 2026 World Cup Predictions piece, where you’ll find analysis, favourites, and current betting odds.